
Annual inventory in the hospital pharmacy: traceability, efficiency and loss analysis
Annual inventory in the hospital pharmacy: save time, trace every count and understand where the losses are, with the example of Brugmann Hospital.
What if the inventory figures could be read during the count, with no retyping or consolidation? A short video (in French) gives a preview.
Hospital pharmacists master their annual inventory: preparation, sorting, pre-counting and organising the teams are part of their profession. What often weighs more heavily lies around the count itself: sheets circulating, quantities being retyped, results being consolidated, and then the search for discrepancies once the operation is over.
This article looks at that information side. It draws on what we observe with the teams using our tools, notably at Brugmann Hospital, around three questions: how to save time on the day, how to keep a trace of every count, and how to understand where the losses are.

The Brugmann Hospital team gathered for the inventory
What counting on paper leaves aside
In the field, the same intermediate tasks come back year after year:
- count sheets to gather and sort,
- handwriting to decipher or an ambiguous digit, forcing a recount,
- quantities retyped into a file or into the management system, with double entry and a risk of typing errors,
- results from several teams to consolidate, often once the count is over,
- and, in the end, little information on which counter entered what, where and when.
These tasks add nothing to the quality of the count. They lengthen the operation and leave little material to analyse the result.
Saving time: the example of Brugmann Hospital
At Brugmann Hospital, the pharmacy carried out its inventory with the Inventory module of Picking Pilot. In the field, the teams used the wrist-worn, hands-free aRdent ScanDisplay terminals to scan and record quantities. The process was as follows:
- a location is scanned, then the medication box concerned,
- the quantity is entered on the spot,
- expired boxes are flagged,
- then the team moves on to the next item.
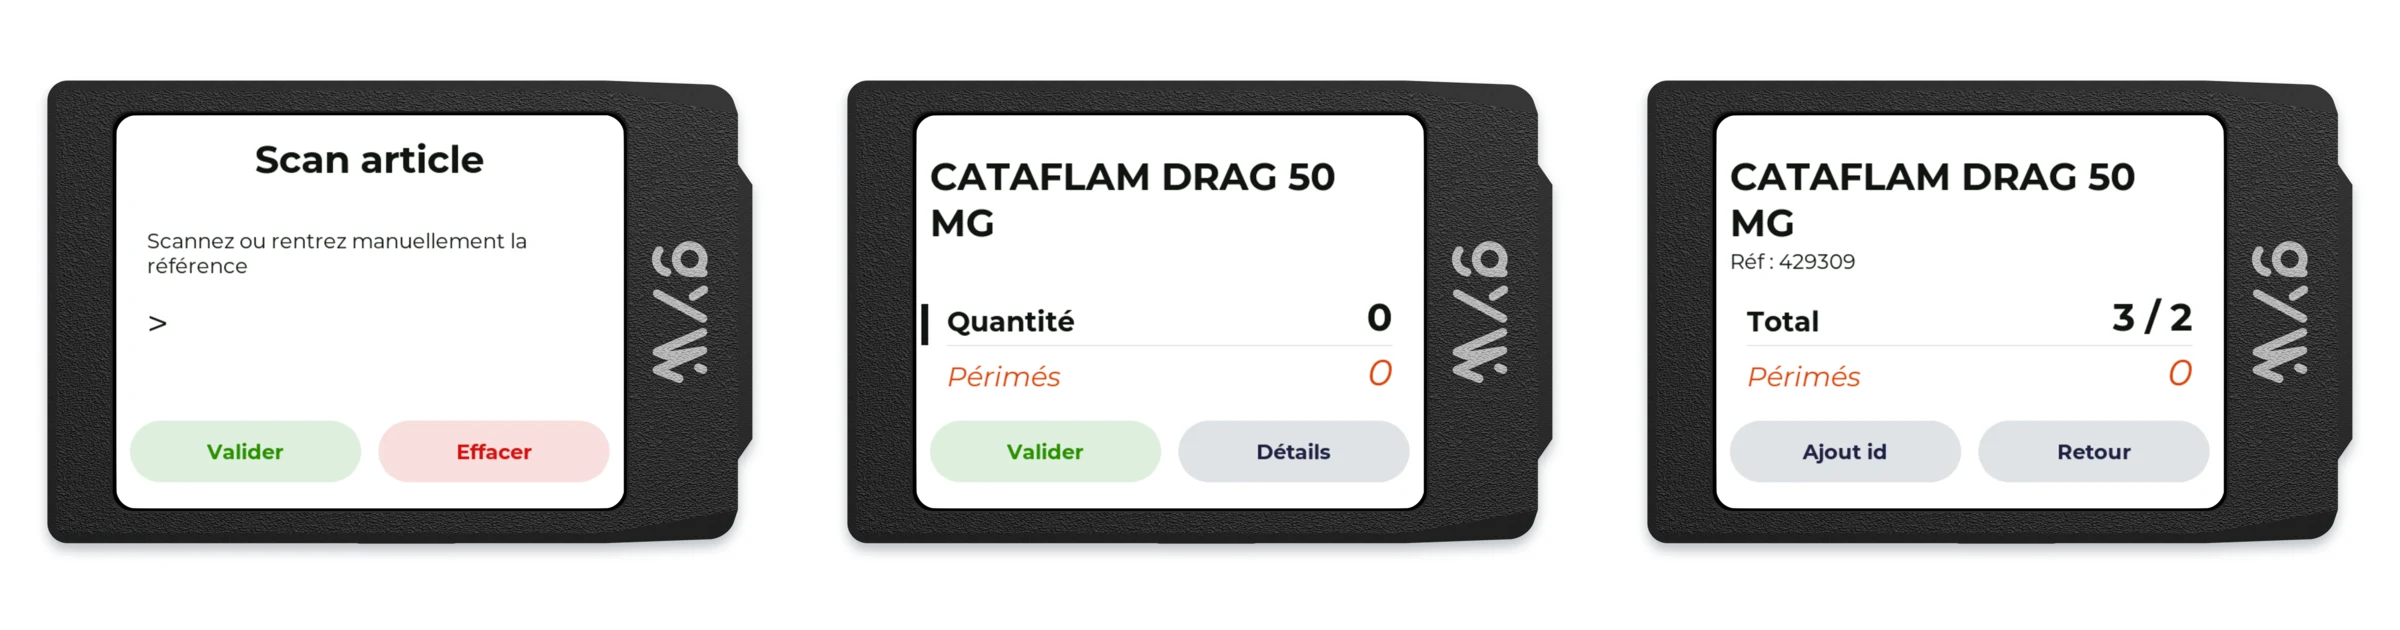
Screens of the aRdent ScanDisplay terminal during counting: item scan, quantity and expired units, item details (interface in French)
Six people worked in parallel, each equipped with their own aRdent ScanDisplay terminal connected to the platform, recording their counts directly on the terminal, each on their own side. The data was centralised in Picking Pilot, then fed into the hospital's management system (InfoHos, from Zorgi). The inventory finished 90 minutes earlier than usual. This gain owes a great deal to the disappearance of intermediate tasks: no retyping, no double entry, immediate consolidation.
Seeing progress in real time
Because quantities are recorded at the source, progress can be consulted during the count without interrupting the teams: percentage of references counted, number of entries, duplicates, references not on the list, split between exact references and those above or below the expected quantity, and a zone-by-zone counting plan with the counters involved and the time of the last count. Managers see where the count is moving and where it is falling behind, without waiting for the end of the day.
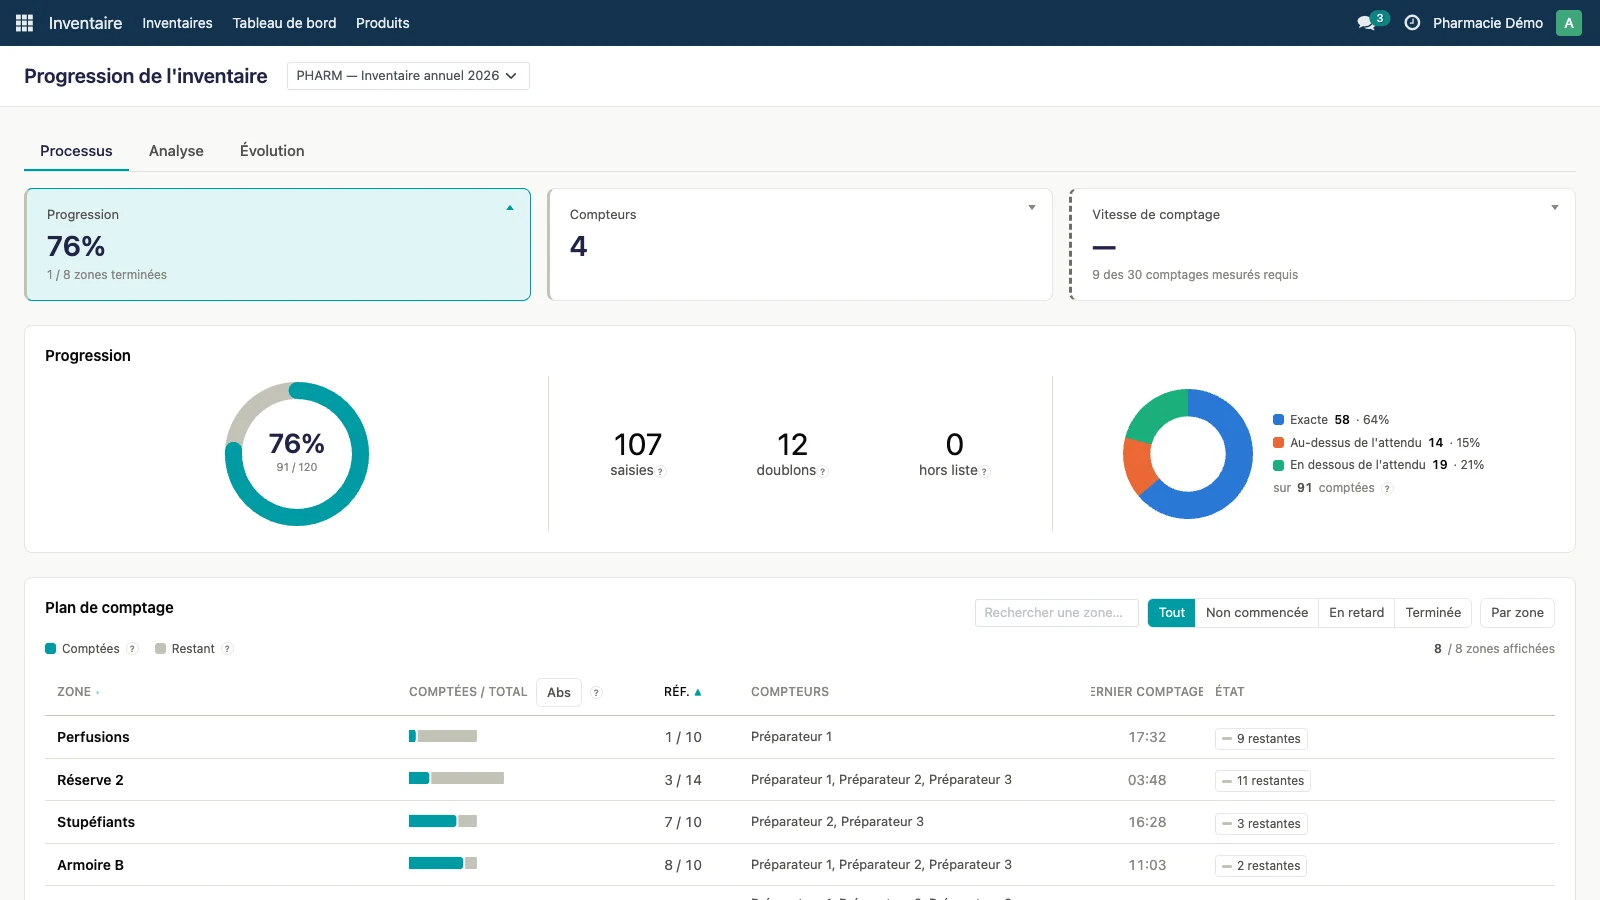
Count monitoring in Picking Pilot: overall progress, entries, duplicates, status of references and counting plan by zone (demonstration data, interface in French)
Tracing every count: duplicates and recounts
When several people count in parallel, the same item may be recorded several times, sometimes at different locations. A large discrepancy often calls for a recount. In both cases, the useful information is not only the final quantity but also the history: who recorded which quantity, at which location, at what time.
In Picking Pilot, every entry is kept with its author and its time, and the counted quantity of a reference is the sum of its entries. Duplicates therefore show up, zone by zone, instead of disappearing into a total, and a recount is added to the history instead of overwriting it. The final result remains auditable: every figure can be traced back to the entries that produced it.
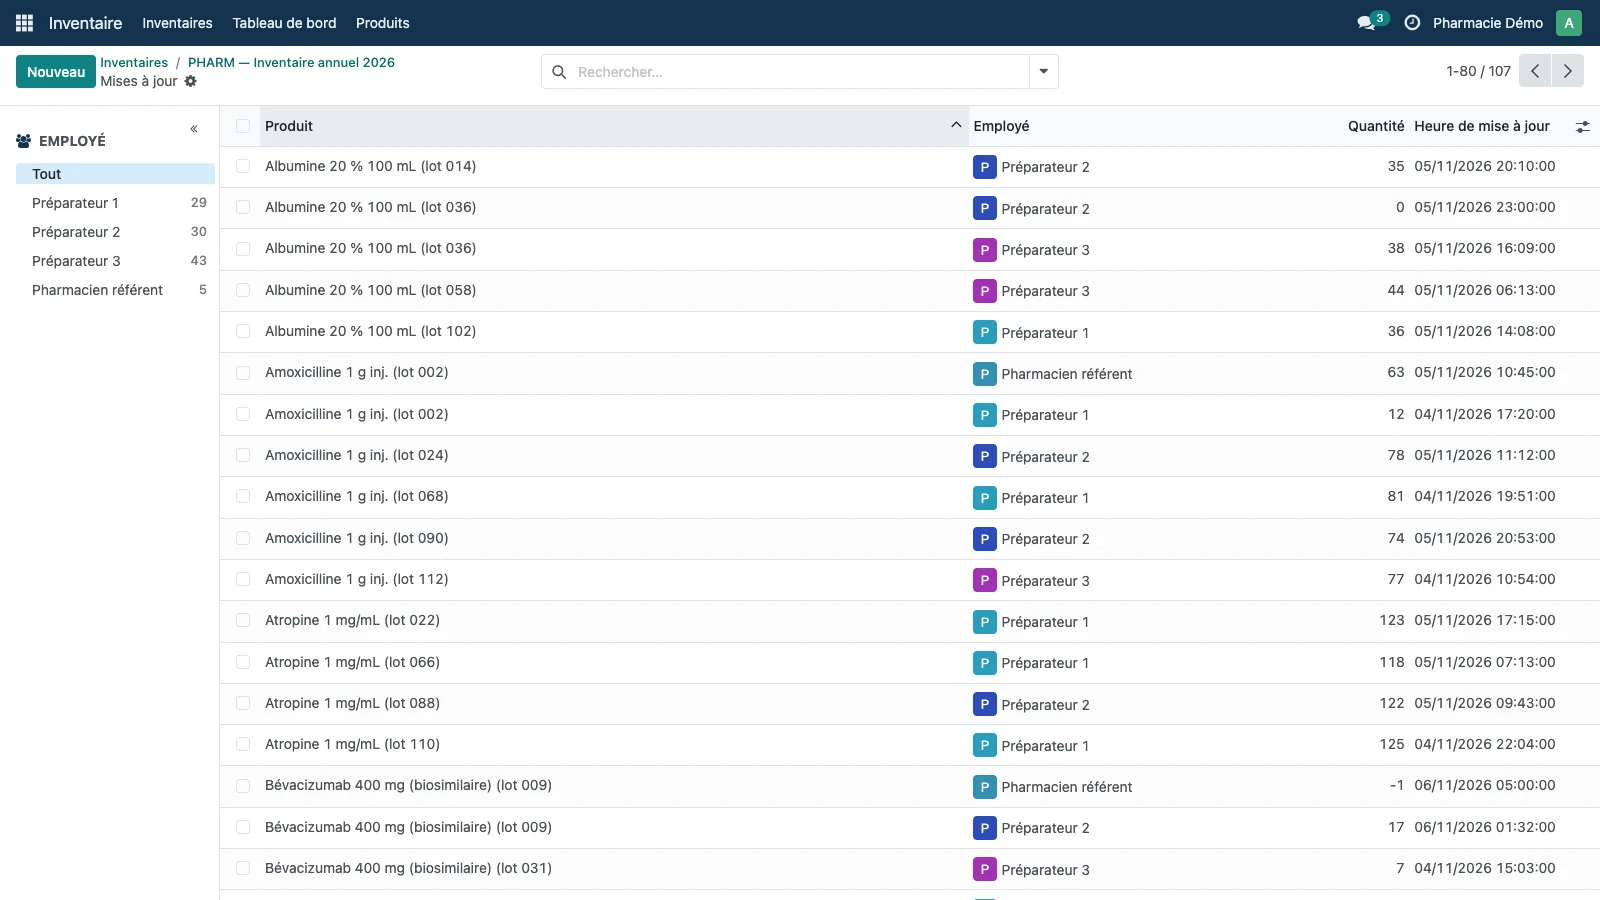
Entry history of the inventory in Picking Pilot: product, counter, quantity and time of each entry (demonstration data, interface in French)
Understanding where the losses are
Once the count is finished, the question that matters to the pharmacy is rarely the number of discrepancies but their value and origin: shortages, surpluses, losses due to expiry. Ranking by value highlights the references that really matter. In the demonstration example below, the most costly reference alone weighs 2,400 € out of 6,294.50 € of recorded losses, and the net balance, losses and surpluses combined, stands at −3,106.90 €.
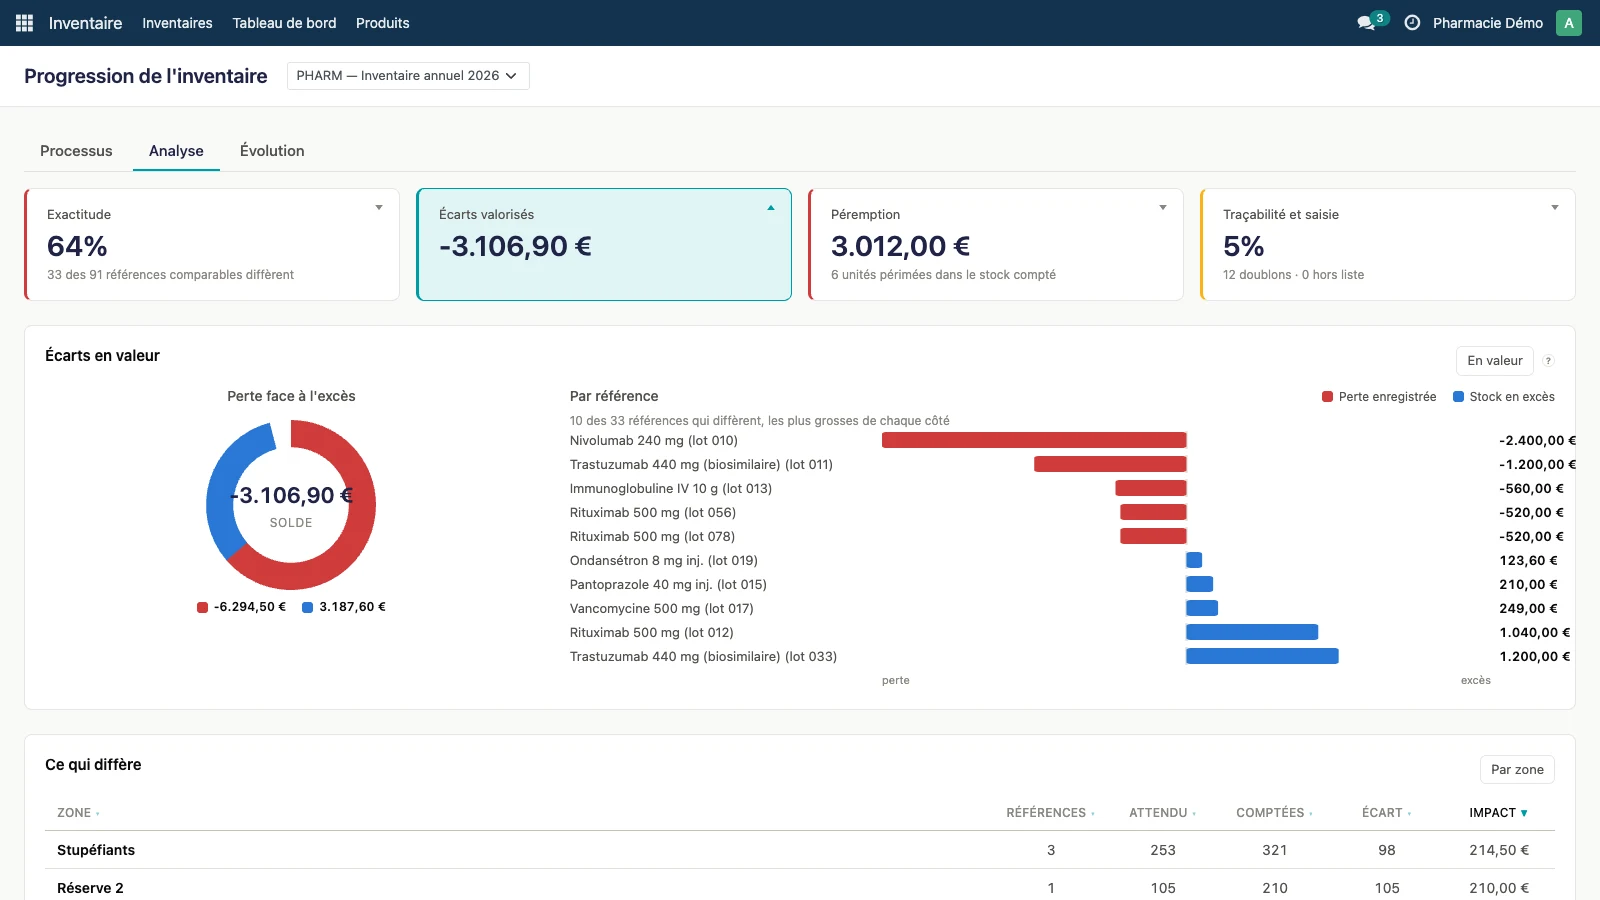
Valued discrepancies in Picking Pilot: balance, losses versus surplus and ranking of references by value (demonstration data, interface in French)
Losses due to expiry have their own view: value of the expired products found during the count, detail by reference, and a split between products expired for more than 30 days and the others. They can therefore be read separately from other discrepancies.
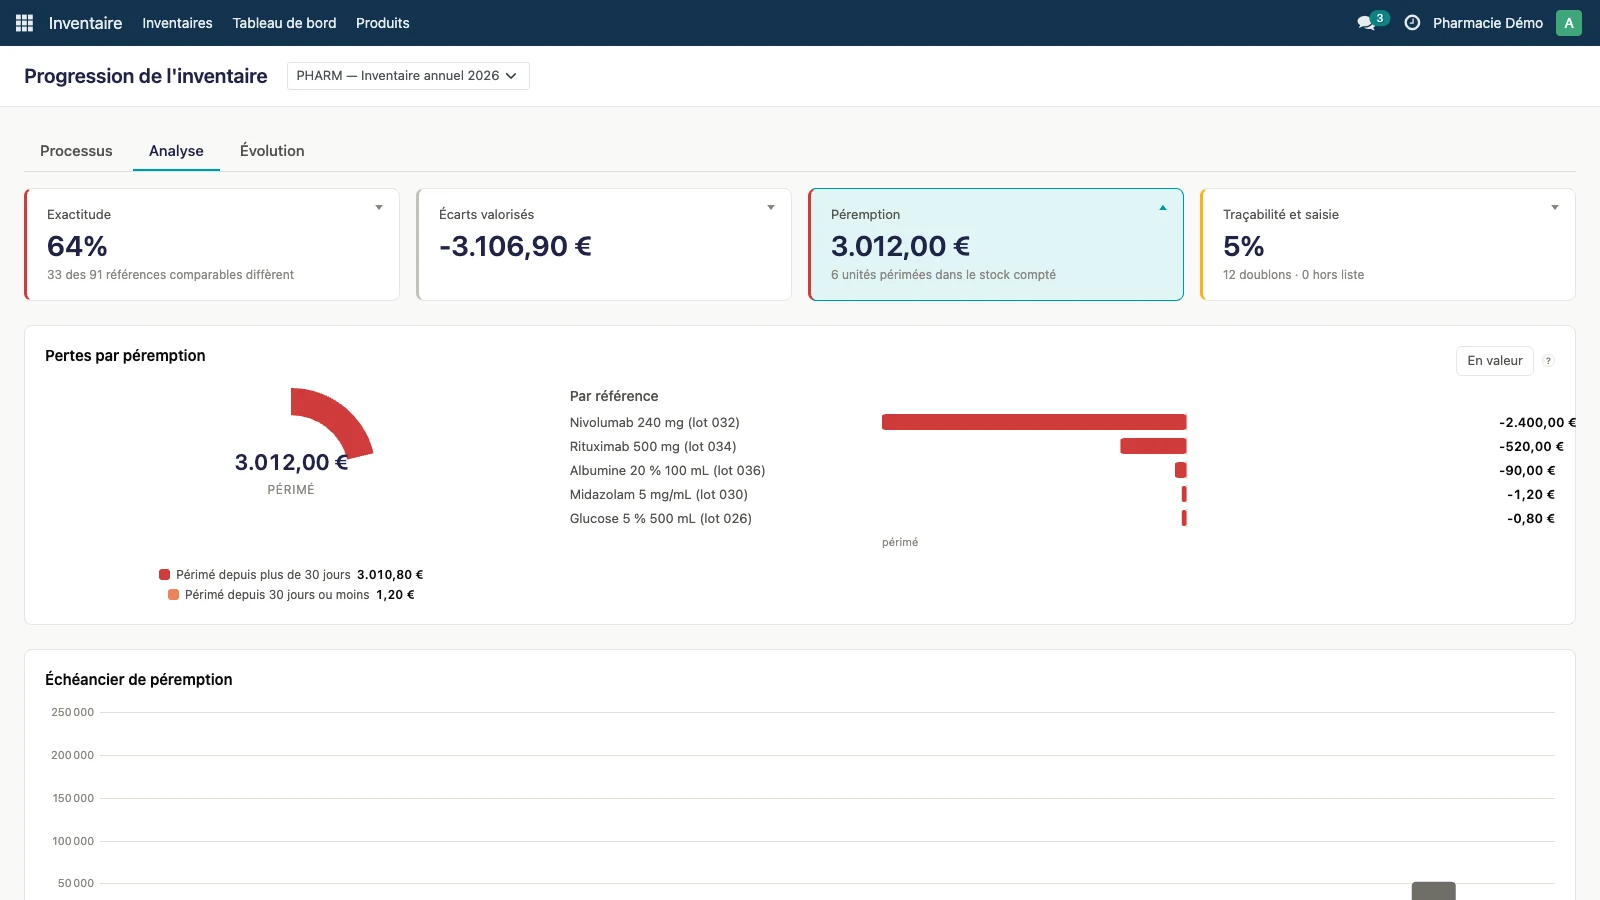
Losses due to expiry in Picking Pilot: value of expired products, detail by reference and how long ago they expired (demonstration data, interface in French)
Exporting the report
The report is exported from the inventory, as CSV, as Excel or in a dedicated Infohos format, with the option to keep only counted products, add new products and include the expired quantity. Other counts can also be added, entered manually (for another zone, for example) or coming from the export of another device, to consolidate everything into a complete, clean file, ready to be imported into the stock management software, with no new data entry into a spreadsheet.
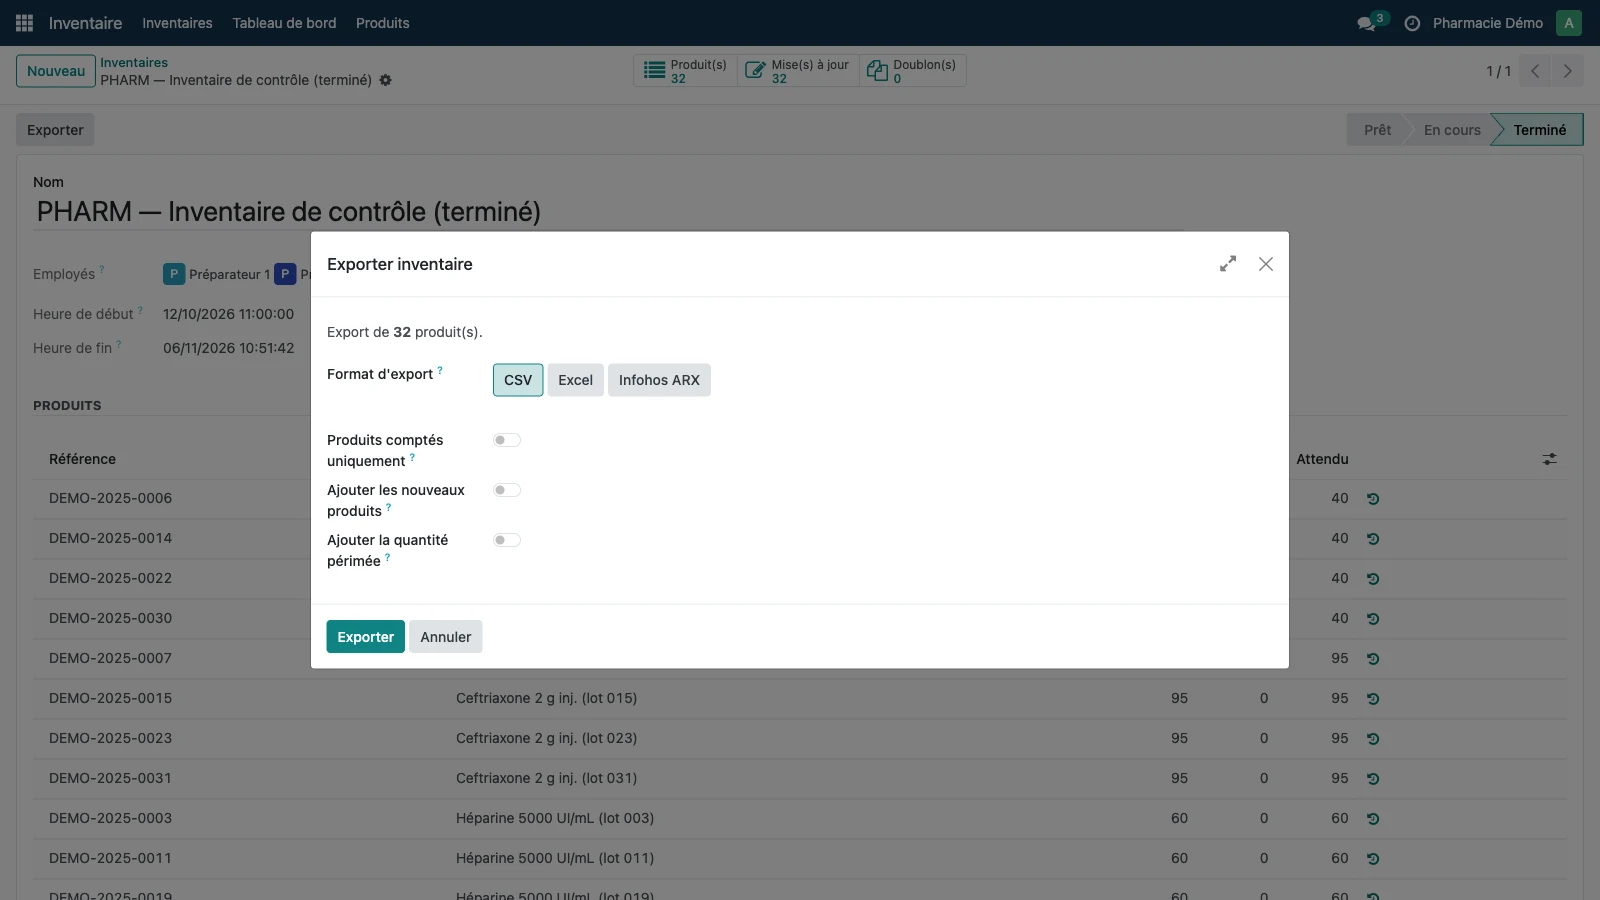
Inventory export wizard in Picking Pilot: CSV, Excel and Infohos formats, and content options (demonstration data, interface in French)
In short
The count remains the business of the pharmacy teams. What digital tools bring lies on either side: fewer intermediate tasks during the operation, a complete history of every entry, and indicators that quickly show where the losses are. Get Your Way offers this approach with the Inventory module of Picking Pilot and the hands-free aRdent ScanDisplay terminals, presented in 1 minute 16 in the video at the top of this article (in French), also available on our Videos page.
Discover the hands-free terminal · Talk about your next inventory
Links
YouTube: Inventaire annuel en pharmacie hospitalière : êtes-vous vraiment prêts pour le jour J ? (video in French)
Get Your Way: Our videos